
Tags
"The Atlantic", baseball, Brian Mills, Doc Ellis, Hitting, MLB, No-Hitter, Pirates, Pitch f/x, Pitching, Strike Zone, Umpires

(Jacob deGrom Ties MLB Record, Strikes Out 8 Straight. Pix-USA Today)
Have you noticed how it seems hitting has been trumped by pitching in baseball, not only this year but for a number of years now?
With Red Sox in last place, 26 games behind the AL East winner Orioles, I have had a good deal of time to think about more than just my beloved team and their miseries. While I have enjoyed the Nats’ good season, it’s not the same as rooting for Boston.
Looking at some box scores a few weeks ago, I was struck by what seemed to me to be low batting averages, even of the best players for the best teams in baseball. In fact, when I looked at the six leading teams in all the MLB Divisions, only two clubs had anyone hitting over .300 (one of those two teams just had one player hitting .301, and he is now below .300).
I began looking at other statistics, going back as far as 2000. Here are just some of the things I found when I looked at every year from 2000-2014 (being retired and having a losing baseball team allows for spending time on such matters):
**In 2000, 17 teams scored over 800 runs. By 2008, that was down to seven teams. Today no team will score that many and only five teams are likely to score over 700 runs.
**In 2000, there were six players who had over 200 hits. In 2008, it was three. This year only one player is likely to have that many hits.
**In 2000, 30% of the MLB players were hitting .300 or higher. In 2008, that was down to 23%. Today, only 11% are likely to break .300.
**In 2000, 15 players had a slugging percentage over .600. In 2008, it was down to two. Today, no one will be over .600.
**In 2000, 58 players struck out over 100 times in the season. In 2008, that was up to 88. And today, that number will likely be over 130.
**In 2000, there were only six pitchers who had over 200 strike outs. That climbed slightly to eight in 2008. This year the figure projects to 15.
So, Batting averages are down. Hits are down. Slugging is down. Runs are down. Batters are striking out more. More pitchers have more strikeouts than ever before.
Why?
Steroid issue? Better pitching? Better defense?
I came across an article (thanx to an alert MillersTime reader) in The Atlantic that looked more closely at what was going on and came to the conclusion that a significant portion of the change in balance between the pitchers and the hitters had to do with something no one expected:
Near the end of the 2006 season, the first cameras appeared that recorded balls and strikes. By 2008, all the MLB teams had these cameras (Pitch f/x technology, tracking pitch speed, break, and location). Then MLB began rating their umpires using what these cameras showed. Four umpires who scored poorly in their ratings were fired. Some who rated well earned bonuses.
What it appears happened was that the cameras showed that umpires were not calling strikes in the lower 15% of the strike zone. In the top of the zone, they were pretty accurate. Inside and outside pitches they missed a bit, but it was the low ones that they weren’t calling strikes.
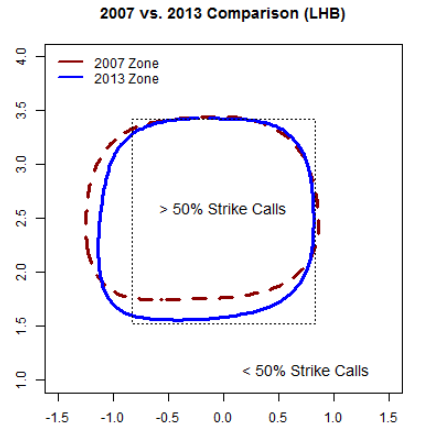
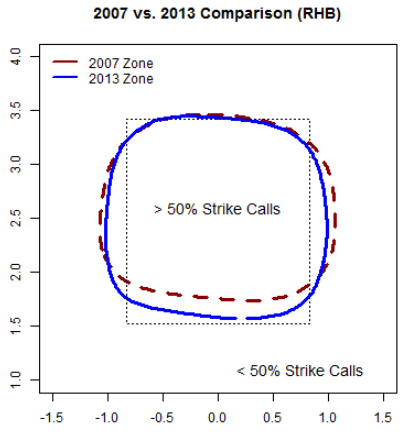
(Charts by Brian Mills)
Once this fact became known and corrections began (umpires calling more low strikes), the pitchers caught on and were credited with more low strikes than previously. Plus, according to one analysis, when hitters got behind early in the ball/strike count, they, of course, were less successful hitters. One analysis credited 40% of the decline in run production to the factor of the unintended consequences of the cameras entering the game.
If you want to delve further into this issue, take a look at this terrific article from The Atlantic: The Simple Technology That Ruined Baseball. It is about more than what the title implies.
And even better, look at the wonderful analysis by Brian Mills in the study he did for MLB, published in August 2014: Expert Workers, Performance Standards, and On-the-Job Training: Evaluating Major League Baseball Umpires. (Note: once you go to this site, you must click on “Download This Paper”, and then perhaps click on “Download Anonymously. It’s worth the few hoops you have to go thru.) Don’t be put off by the title. if you download the article, know that the most interesting parts come in the second half of Mills’ study.
Let me, and others know, what you think about all of this.
* ** ** ** ** ** ** ** *
No No: A Dockumentary ***1/2
 If you’ve followed baseball at least since the beginning of the 70s, then the name Doc Ellis is probably familiar to you. He pitched primarily for the Pirates, tho he also did a bit of time with the Yankees, Athletics, Rangers and Mets.
In this just released documentary, we are treated to a portrait not only of the best known facts of his career (pitching a no-hitter while on LSD) but to the story of his rise to the Majors, his eventual decline, and what happened to him following his retirement in 1979.
Like most documentaries of this type, his story is told through the use of archival films as well as interviews with his two wives, his sister and a number of his teammates and others who knew him well. Sometimes the chronology is a bit askew, but No No is worth your time.
Ultimately, it is the story of a black baseball player who challenged many of the orthodoxies of his time (he was often compared to Mohammed Ali) and whose story is one that is fascinating and gripping not only from an historical perspective but one that is also pertinent in light of what is occurring today in the world of sports.
